The amount of information that retailers have to collect about competitors from various sources only competes with the amount of data that is generated by the online store itself. Today, working with lots of data is the norm if you want to work effectively. At the same time, the excess of information that we get and its low quality, often causes retailers not to make the right conclusions as well as not make quick and informed decisions.
It’s the quality of data that determines the economic effect for the business: high-quality, clean and timely data is the basis for having quality analytics and as the retailer, make effective strategic and tactical decisions. The quality of data directly affects pricing, since it underlies the rational revaluation:
In this sequence, the first phase, which is the collection and consolidation of data, is the foundation. It affects the final result. Poor quality, also known as “raw materials”, lead to erroneous decisions, lost profits and a deterioration in your market position.
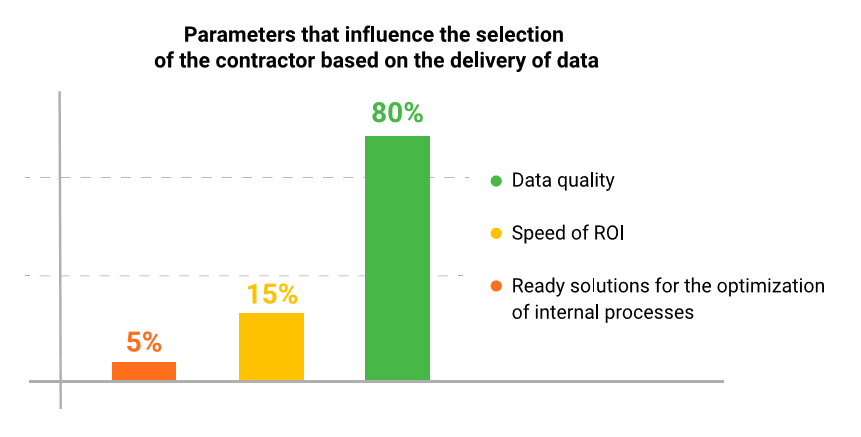
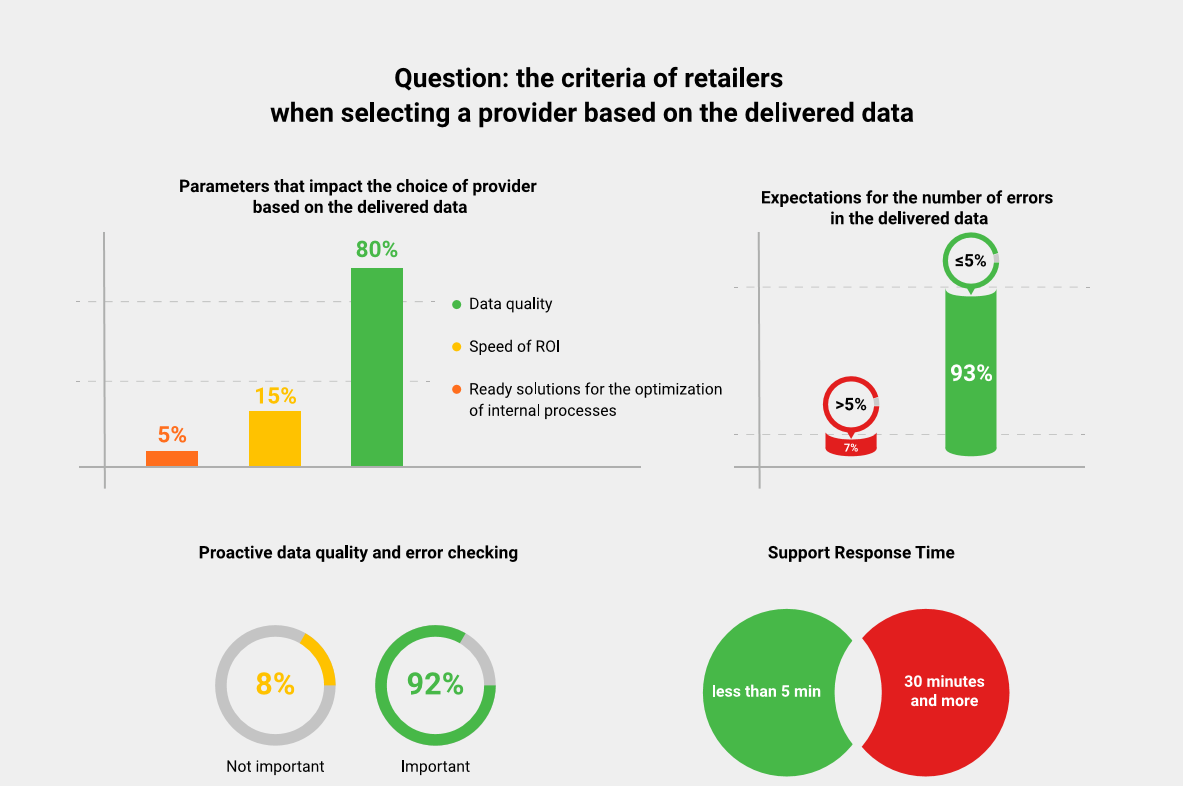
Today, 200 retailers from 18 countries use Competera products. According to Competera’s internal survey, 80% of the company’s customers consider the quality of a competitor’s data to be the key factor that guides them when they are choosing a partner for the introduction, development and improvement of pricing processes.
The main purpose of this study is to standardize the notion of “quality data” so that retail representatives can use benchmarks to assess the quality of the data received from their suppliers.
As part of the study:
The study answers to these and other questions about data in retail:

6 countries: Great Britain, USA, Netherlands, Malaysia, Russia, Ukraine

3 industries: Consumer Electronics, Hypermarkets, Health & Beauty

Assortment:
from 50,000 products
The quality indicators in the study are relevant for a properly tuned process for collecting and processing data with multiple quality checks for errors and anomalies:

For input data, the catalog of the retailer’s goods, the list of competitors and the required schedule for scanning competitors (refer to “freshness of data”) is used. Incoming data is updated according to a specified schedule.
After processing incoming data and comparing the retailer’s products with the competitor’s, we get an enriched catalog of SKUs, which will be used to collect data from competitors’ sites (refer to “Competitors' Assortment Hit Ratio” section).
Data is collected from selected websites according to a predefined scan schedule. The list of websites for scanning can be adjusted after several iterations as long as the scanned competitors are not key (read the article on how to choose products and competitors for monitoring).
The data collected on competitor’s sites is checked for quality (refer to “the number of non-zero prices” and “the percentage of errors”) and is structured and visualized in the suitable form for the retailer.
This step may be the last, but not least, in the entire sequence (refer to the corresponding paragraph).
If the data acquisition process is properly configured, you can proceed to assess the quality of the data received. As a result of the research, the five main indicators of the data quality were identified.
The number and accuracy of the obtained matches of products with similar parameters is the first thing that helps the retailer to understand how good the data is. The assortment hit ratio can be measured quickly using the percentage of comparisons, yet its accuracy is affected by the type and depth of matches.
Depth is the second most important parameter, but it is often overlooked when calculating the percentage of matches. It takes into account each option of the selected product such as its colors, technical characteristics, and other parameters. The latest often are not available on the main product card.

The ideal situation is when the retailer gets the most profound and accurately mixed matches. In this case, the indicator, “assortment hit ratio”, will be highly informative:
This indicator shows the percentage of prices found on the competitor’s site. Sometimes, due to various reasons, a certain amount of zero prices appear during scanning:

Some retailers, when re-evaluating products, drive off of those that were based on data that was collected a day or more before the revaluation. Naturally, that kind of data can’t be a qualitative basis for analysis and decision-making. Retailers need to get the most relevant data at the time decisions are made on price changes, so it’s important to take into account another indicator of data quality — the percentage of “fresh prices” collected in the two-hour range prior to revaluation.

Important: This indicator directly depends on what technology the data provider uses to collect it. If the supplier collects data on the entire catalog of the competitor, from the moment you receive the first price to the moment you receive the last one by the retailer, up to 72 hours could have passed. If the collection occurs with a link to specific URLs of the goods, then the percentage of fresh data will be much higher, and the data itself will be more accurate.
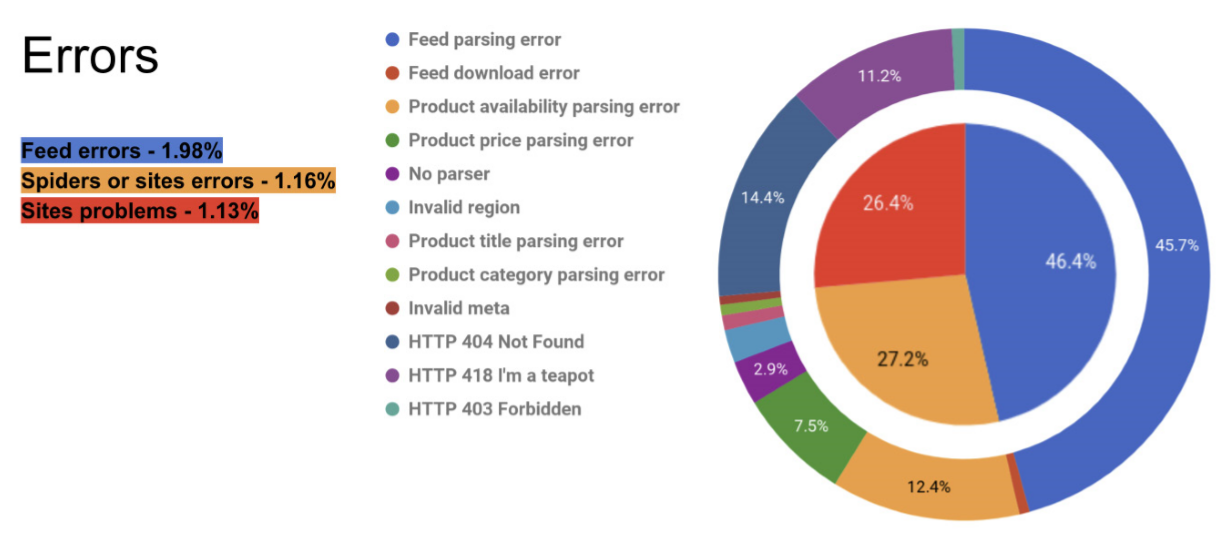
Despite the high accuracy, data collectors (parsers, crawlers - programs that collect data) are not immune to errors. The ideal variant is when the program of the collector is checked by either another program and/or person.

In this case, the competitor data collection system not only effectively collects the necessary data and checks for errors, but also, even identifies every possible problem with the collection in order to notify the user what exactly caused the data to be received with errors.
Data can be considered smart only if its quality is verified by scientific methods using special algorithms.
The less time that the data needs in order to get into the ERP system of the retailer after collection and processing, all of the processes of the retailer in the analysis and use of the data obtained are simpler and more flexible. As a result, the interaction of every business element is more effective.

The time it takes to deliver the data to the internal system of the retailer should be minimal.
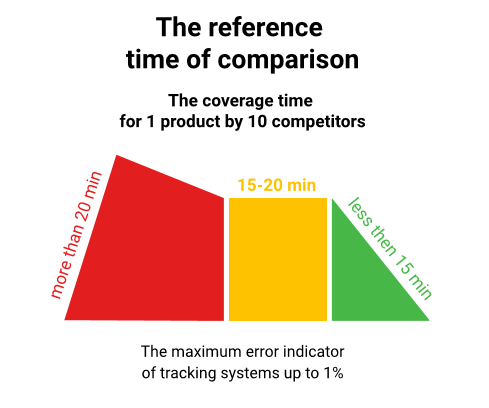

Now that we’ve examined the factors that affect the quality of the data and have seen the figures of the top retailers from six countries collected in the results of the Competera study, it’s possible to simulate the effect caused by the deviation of these indicators from the norm.
For example, let’s take a conventional retailer that’s monitoring 50,000 items from five competitors. In this case, the maximum possible number of units that you can monitor is 250,000.
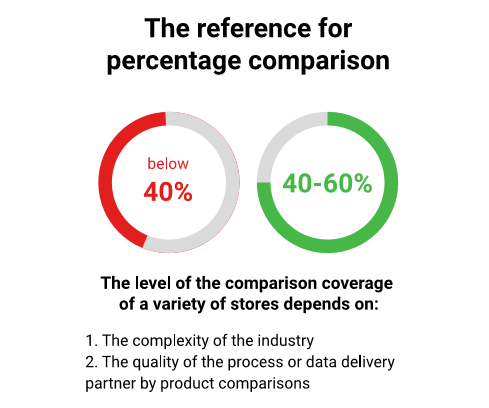
Among the companies selected for research, the competitors' assortment hit ratio runs from 40% to 60%.
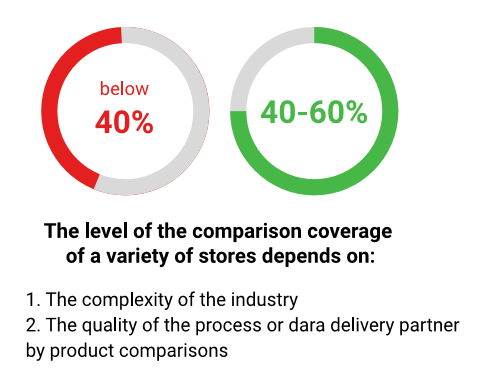
In other words, for the current model, there can be, respectively, 150 thousand, 225 thousand and 37.5 thousand positions. For all further calculations, take the average of 60%, since it corresponds to 150 thousand positions.
The quality of the remaining indicators is provided by the data provider (if the retailer doesn’t work with its own system of information gathering about competitors).
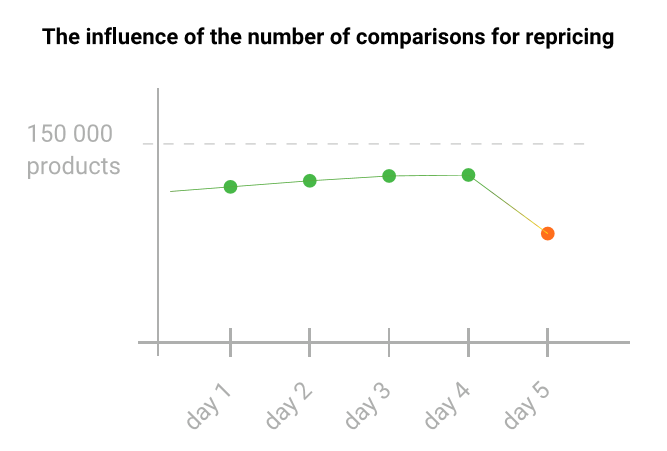
Each retailer independently determines how many non-zero prices to choose as the standard. It is important that this indicator is stable or increases, but it should not decrease.
The appearance of a large number of “zero prices” creates a “blind zone” for the category manager and for the revaluation of algorithms, so the goods with such data are not repriced, and as a result, they’re not sold.
In our example, for instance, suppose that the number of non-zero prices will fluctuate at the level of 150 thousand, but at some point, it will drop sharply to ninety. In this case, the “blind zone” of the retailer will increase by 60 thousand positions in one day.
As we noted above, it’s important that the maximum amount of prices are collected by the retailer in the two-hour range prior to the revaluation of goods. This parameter determines what percentage of prices for analysis and decision-making are delivered to the “critical” period of time, which is necessary for reassessment.
In order to conduct a correct reassessment, the fresh data indicator should fluctuate in a range of 95-98% of the positions of the entire assortment. In our example, out of all of the matched items, up to 147 thousand pieces of data should be delivered in a two-hour range before repricing. This quantity is an indicator of the relevancy of the prices.
The systematic presentation of data with a fixed frequency and schedule is one of the most important factors affecting the optimization of pricing. In this case, the retailer receives the exact data that can be used for revaluation. Otherwise, it can operate with obsolete or “yesterday’s” data, however its sales will fall. This option is similar to the previous example, but the damage from it to the business is slightly lower.
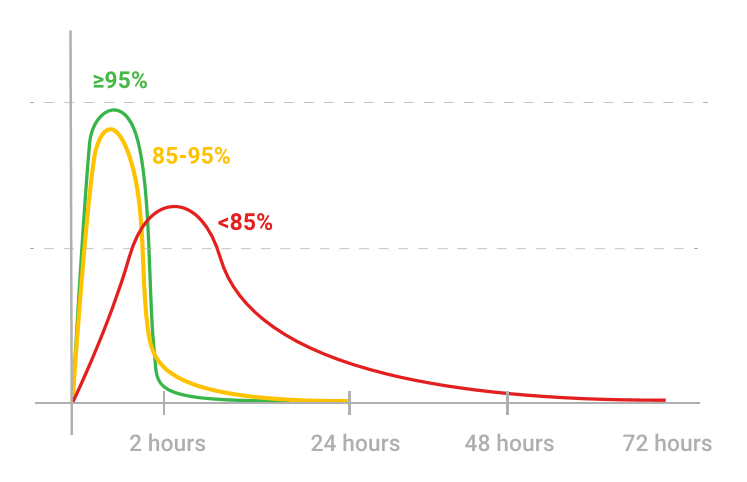
In most cases, the category manager knows the frequency and time of the repricing of its competitors, especially if the Price Index is used in the work. Based on this information, they choose the time to reassess their range, therefore the specific time interval for the appearance of data is critically important: outdated data overlooks possible changes in the competitors.
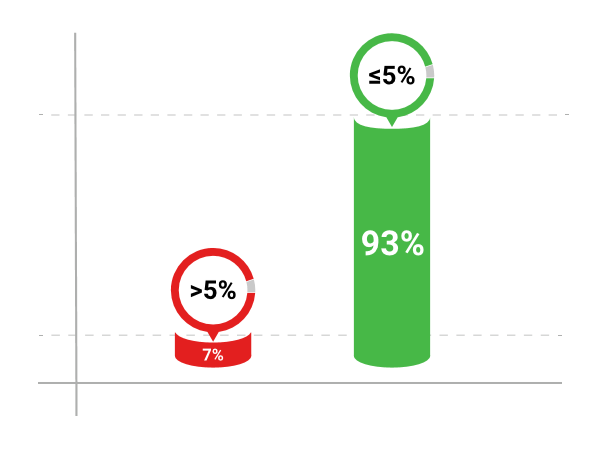
Even the minimal percentage of errors leads to the fact that the retailer incorrectly reprices their goods. That means that you need to strive for a minimum score of erroneous data — from 5% to 2%. If the indicator is higher, in our example (147 thousand goods in a two-hour range), over 8,800 items will be repriced with errors.
The data provider, regardless of whether it is internal or external, must check the quality of its data, evaluate them for errors, give transparent access to the retailer about this information, and quickly respond to errors.
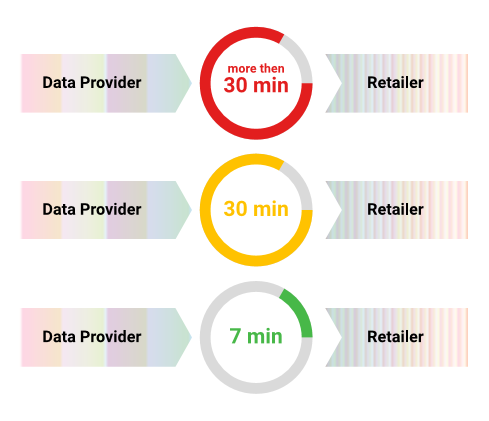
The time it takes to deliver data to the ERP system of the retailer is not as critical as other indicators. At the same time, it affects the overall performance of category managers:
If the manager does not have the task of monitoring and setting up the process of obtaining data and he is solely engaged in their processing, then this reduces their time spent on making repricing decisions.
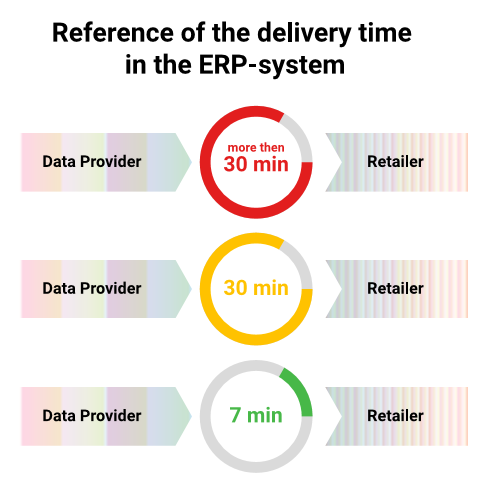
The industry standard for delivering data from the supplier to the ERP is up to 30 minutes (depending on the data transfer method and type of ERP system.) Typically, Competera clients receive new data in their ERP systems in 3-7 minutes.
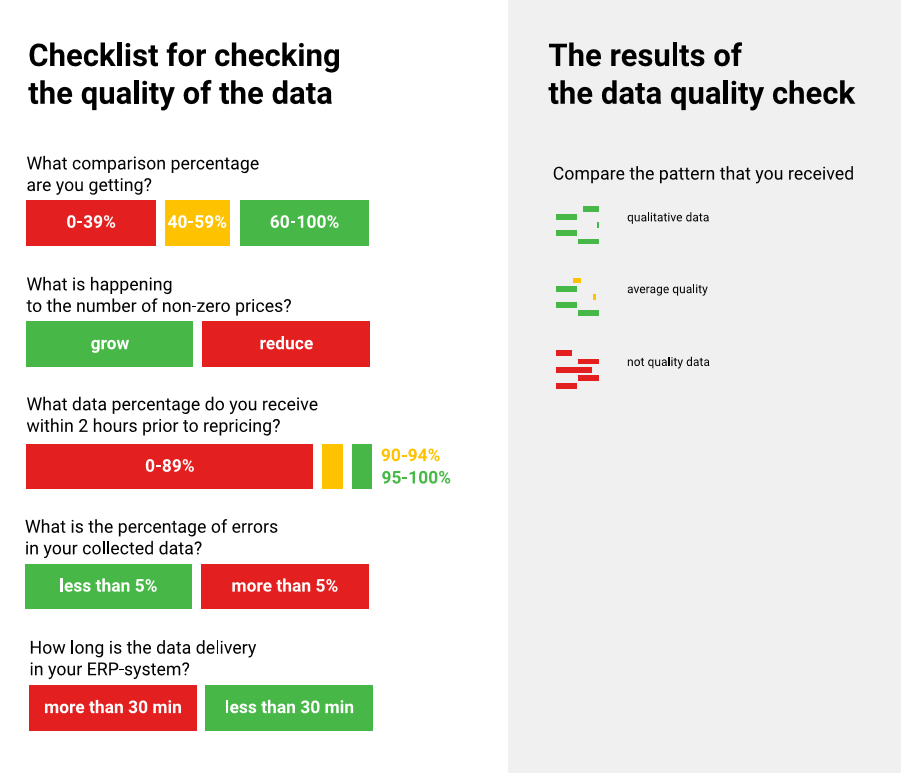
Now that you have read the results of the data quality study from Competera, you can check the quality of your data with the checklist below.
If your data quality metrics are in the green zone, then everything is fine. If some indicator is in the orange or red zone, you should consider talking to your data provider.
to send it to colleague or friend

E-commerce Germany award

Constellation

Crozdesk

London Tech Week

Forrester

Crozdesk
From now on we will be bringing you all the latest retail news and updates right to your inbox
Check our Use cases, Case Sudies, Pricing HUB, Blog or chat with our pricing community manger.