



TL;DR
- Pricing KPIs are the metrics that show whether your prices are winning on profit, competitiveness, and demand.
- They differ from general business KPIs because they isolate the impact of price itself, rather than overall sales or operations.
- The metrics that matter most for enterprise retailers are gross margin, price competitiveness index, price elasticity, sell-through rate, and price perception.
- By evaluating these metrics in real time alongside market shifts, teams can proactively implement daily price adjustments rather than constantly react.
- The common failure is watching one metric in isolation, which pushes teams toward blanket discounting and quiet margin erosion.
What are pricing KPIs?
Pricing KPIs are specific metrics that show how well your pricing performs against profit, competitiveness, and sales goals. They tell your team whether a price change increased margin, protected market share, or moved the exact volume your forecast predicted. For enterprise retailers managing thousands of products, these metrics turn pricing from a gut-feel exercise into a measurable discipline that finance and merchandising can trust.
Why pricing KPIs differ from general business KPIs
General business KPIs measure overall company health, but they blend too many variables together. A jump in total revenue or store traffic could stem from an ad campaign, a new location, or a holiday spike, none of which tell you if your prices were correct.
Pricing KPIs solve this by isolating the exact impact of price. They focus entirely on whether a specific price captured the maximum profit and demand available at that exact moment. Since price is the fastest lever a retailer can pull, tracking the right pricing metrics allows small, measured margin gains to compound rapidly across a massive assortment. This isolated data gives analysts the clear evidence they need to justify and defend price changes to the rest of the business.
Key pricing KPIs for enterprise retailers
The pricing KPIs that matter most for enterprise retailers focus on three primary jobs: protecting profit, staying competitive, and reading market demand. The table below outlines how to calculate and apply each metric in daily operations.
| KPI | Definition | Formula | Retail use case |
| Gross margin and gross margin % | Profit left after the cost of goods sold, in currency and as a share of price. | Revenue − COGS; (Revenue − COGS) / Revenue × 100 | Confirms a price or promotion still covers costs and hits the target margin. |
| Price competitiveness index | How your prices compare with competitors on the same or similar items. | (Your price / average competitor price) × 100 | Keeps high-traffic items in line with the market so shoppers see you as fairly priced. |
| Price elasticity of demand | How much demand moves when price moves. | % change in units sold / % change in price | Shows which products can carry an increase and which lose volume fast. |
| Revenue per unit and average selling price | Average revenue captured on each unit after discounts. | Total revenue / units sold | Reveals whether discounting is quietly lowering the price you realize. |
| Margin per unit and contribution margin | Profit each unit adds after variable costs. | Selling price − variable cost per unit | Ranks products by the profit they contribute to the assortment. |
| Customer lifetime value | Total profit a customer generates across the relationship. | Avg. order value × purchase frequency × lifespan × margin | Justifies pricing that trades short-term margin for long-term value. |
| Price perception index | How cheap or expensive shoppers believe you are, apart from actual price position. |
Survey or secret-shopper score, indexed to competitors | Explains why a price-competitive retailer can still feel expensive. |
| Sell-through rate | Share of received inventory sold in a set period. | (Units sold / units received) × 100 | Signals when a price sits too high or too low for demand. |
Formula definitions follow standard references in marketing and retail measurement. See References.
Gross margin and gross margin percentage
Gross margin is the profit left after subtracting the cost of goods sold, and it is the baseline metric most pricing teams manage first. Measured in currency, it reveals the raw profit earned on a sale. As a percentage, it highlights the portion of each dollar retained before accounting for operating expenses. Enterprise teams monitor this percentage at the category level to catch margin drift early. Many pair it with an inventory-weighted view so that a high margin on slow-moving stock does not hide weak returns overall.
Price competitiveness index
The price competitiveness index shows where your prices sit relative to the market. It is calculated as your price divided by the average competitor price, multiplied by 100. A reading of 105 means your price is 5% above the market, while a 95 means you are 5% below. For high-traffic and high-value items, most retailers keep this index within a couple of points of key rivals to maintain credible pricing. A regular competitive pricing analysis keeps this index accurate as competitors shift their positions.
Price elasticity of demand
Price elasticity of demand measures how much sales volume changes when you adjust a price. It is calculated as the percentage change in units sold divided by the percentage change in price. A highly elastic product loses sales volume quickly when prices rise, while an inelastic item holds steady and can safely absorb higher prices. Understanding price elasticity is what lets a team raise prices where it is safe and protect sales where demand is fragile.
Revenue per unit and average selling price
Revenue per unit, often reported as average selling price, is the revenue you actually capture per item after discounts and promotions, calculated by dividing total revenue by units sold. It matters because list price and realized price drift apart once markdowns pile up. Tracking average selling price against list price exposes that margin leakage and shows whether promotional depth is eroding a category's overall value.
Margin per unit and contribution margin
Contribution margin is the profit each unit adds after subtracting variable costs, calculated as selling price minus variable cost per unit. It identifies which products genuinely fund the business once you strip out costs that scale directly with volume.
Ranking an assortment by contribution margin is a core input to margin optimization. It shows teams exactly where to defend prices, where to scale volume, and where thin returns are no longer worth the physical shelf space.
Customer lifetime value
Customer lifetime value, or CLTV, is the total profit a customer generates across their entire relationship with your brand, not just a single basket. While exact mathematical models vary by retailer, CLTV generally tracks the interplay between average order value, purchase frequency, historical retention rates, and product margins across the entire customer lifecycle. Pricing teams use CLTV to assess when a lower headline price or a loyalty offer pays off over time, rather than analyzing every pricing decision on a per-transaction basis.
Price perception index
The price perception index measures how cheap or expensive shoppers believe your prices are, which often differs from where your prices actually are. It is gathered through shopper surveys or secret shopping and indexed against competitors, rather than calculated from price data alone. The metric is important because perception drives store choice. A retailer can be competitively priced on paper and still lose visits if customers feel it is expensive.
Sell-through rate
Sell-through rate is the share of received inventory sold within a set period, calculated as units sold divided by units received, times 100. It links pricing directly to demand, since a low rate often means the price is too high for how customers value the item, while a very high rate can mean you left margin on the table. Reading sell-through alongside demand forecasting helps teams clearly separate a pricing problem from a broader supply chain issue.
How to measure and track pricing KPIs
Measuring pricing KPIs effectively comes down to three operational habits: tracking each metric at the speed at which its data actually moves, tying every metric to a concrete decision, and avoiding the traps that can make numbers misleading. Enterprise retailers manage thousands of prices across channels, so the goal is not more dashboards but a clear cadence and a clear owner for each KPI.
Setting the right KPI cadence
The right cadence matches each KPI to the speed at which its underlying data changes. High-volume and e-commerce categories need daily tracking, while slower-moving assortments move to weekly or monthly cycles.
- Daily to weekly. Track the price competitiveness index and promotion rate daily to weekly, since competitor moves and demand shifts happen quickly.
- Weekly. Review gross margin and sell-through rates at the category level to catch negative margin drift before it compounds.
- Monthly or quarterly. Assess strategic metrics such as price elasticity and customer lifetime value monthly or quarterly once the data is sufficiently stable.
E-commerce platforms and fast-moving retail categories naturally sit at the daily end of these ranges. Slower business-to-business catalogs and long-life-cycle assortments can safely move to weekly or monthly reviews without losing their signal.
Connecting KPIs to pricing decisions
A pricing KPI only earns its place when it changes a business decision. The ultimate point of tracking is to move from simply noticing a number to actively changing a strategy, which means every metric needs a clear threshold and an owner who responds when a number crosses that line.
For example, when sell-through in a category falls below target, that drop should prompt a test of a price change, not just be a figure to record on a slide. When the price competitiveness index drifts above the market for high-traffic items, it identifies the exact SKUs that require a defensive response. Centralizing these signals in pricing analytics software removes the manual work of pulling numbers from separate systems. It connects KPI tracking directly to price optimization, ensuring the metric and the response live in one place.
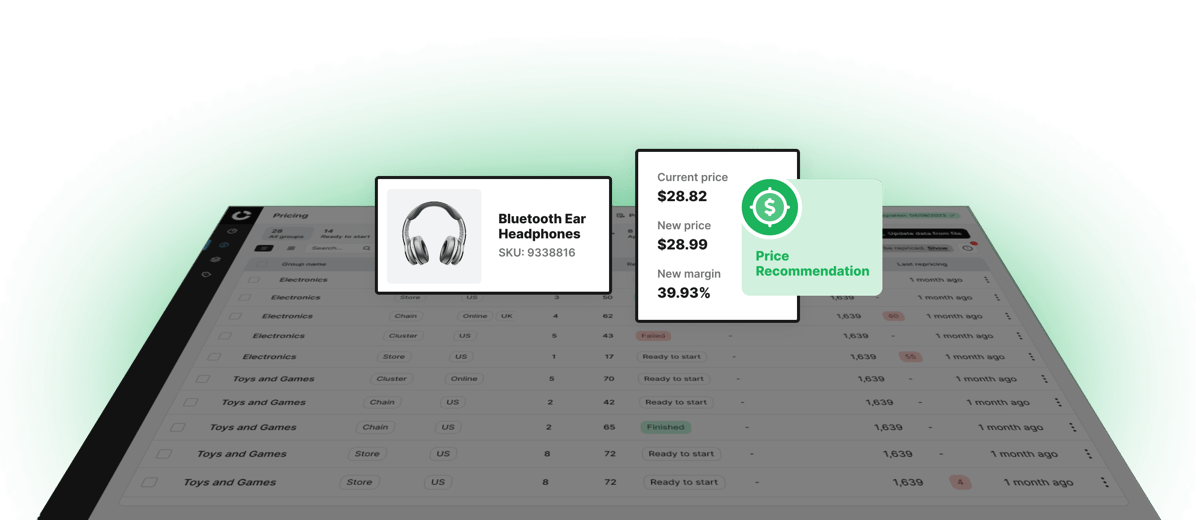
Competera’s Pricing Platform connects KPI tracking directly to AI-driven price recommendations, so every pricing decision is informed by current performance data.
Common KPI tracking mistakes in enterprise retail
The most common tracking mistakes come from reading KPIs in isolation or letting numbers sit without action. Enterprise teams tend to fall into the same predictable traps as their assortments and channels expand:
- Watching one metric alone. Chasing a high score on the price competitiveness index without strict margin guardrails pushes teams into a race to the bottom.
- Ignoring price perception. A retailer can meet its exact price index targets on paper and still lose visits if shoppers perceive the brand as too expensive.
- Defaulting to blanket discounting. Broad markdowns lift short-term volume while quietly eroding realized price and margin.
- Tracking too many KPIs without owners. Metrics that lack accountability quickly become passive dashboards that no one acts on.
- Using stale data. Reviewing a weekly metric on a monthly schedule hides the exact moment a price stopped working.
Conclusion
Pricing KPIs give enterprise retailers a clear read on whether their prices are working across margin, competitiveness, and demand. The teams that extract the most value from these metrics track each number at the right cadence, assign clear ownership, and connect every data point to a specific pricing move. Managing metrics this way allows pricing teams to move past reactive competitor matching and focus on intentionally balancing margin and market share targets.
Competera’s Pricing Platform tracks pricing KPIs and translates them into daily price recommendations across your full assortment. Book a demo to see it applied to your assortment today.

References
- Corporate Finance Institute. (n.d.-a). Contribution margin ratio: Definition, formula & examples. Retrieved July 9, 2026
- Corporate Finance Institute. (n.d.-b). Gross margin ratio. Retrieved July 9, 2026
.webp)