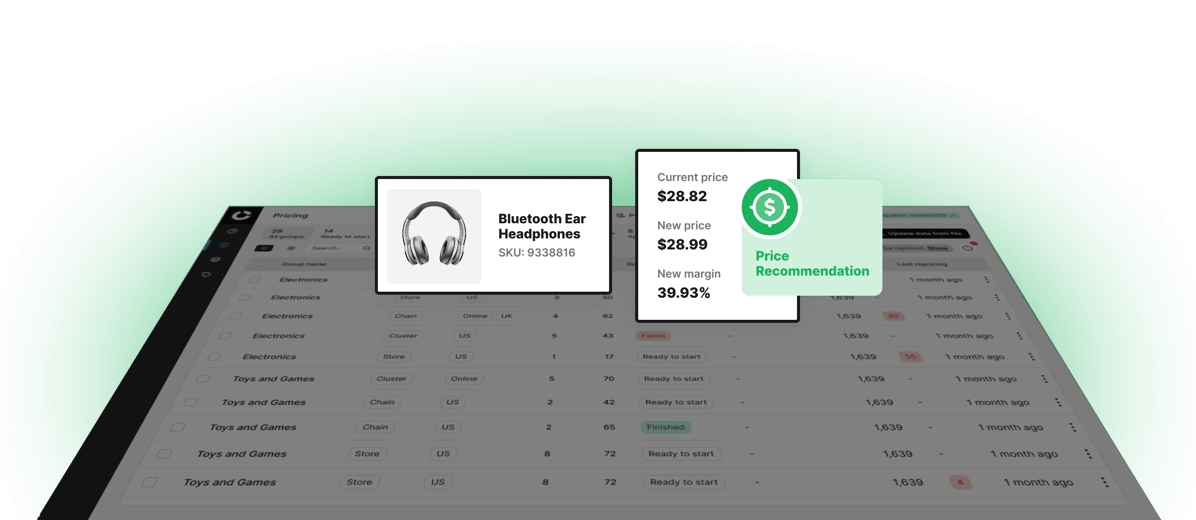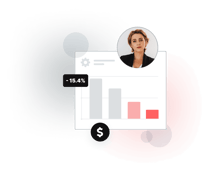




A price waterfall shows how a product's list price shrinks, step by step, into the pocket price a retailer actually keeps. Markdowns, promotions, loyalty rewards, delivery subsidies, returns, and fees each take a share along the way, and the waterfall maps every one of them.
This guide covers the price waterfall definition, its components, a worked price waterfall example, how to run a price waterfall analysis, and how enterprise retailers use it to recover margin.
Key takeaways
- Pocket price is the list price minus markdowns, promotions, loyalty rewards, delivery subsidies, returns, and fees, plus any supplier funding.
- A price waterfall shows where the gap between list price and pocket price opens up, one deduction at a time.
- Retailers use price waterfall analysis to see whether a promotion generated profitable volume or simply gave margin away.
- Run regularly, the analysis exposes inconsistent discounting and hidden backend costs before they become standard practice.
What is a price waterfall?
A price waterfall is a method that shows how a product's list price changes after discounts, promotions, fees, and other deductions, down to the pocket price a retailer actually receives. McKinsey consultants Michael Marn and Robert Rosiello introduced the pocket price waterfall in a 1992 Harvard Business Review article, and it has since become a standard tool in pricing analytics.[1]
Why the gap between list price and pocket price matters
List price says little about profitability on its own. Once markdowns, loyalty perks, delivery costs, and other price components come off, the price a retailer keeps can be far lower. This gap between list price and pocket price is often called price leakage, and it quietly erodes profit margins. It's closely related to price variance, which measures the difference between an expected price and the price actually realized.
What a price waterfall diagram shows
A price waterfall diagram (or waterfall chart) starts with the list price as a full bar, then shows each deduction as a step down, in sequence, until it reaches the pocket price. It works as a visual audit trail for revenue: the biggest steps show at a glance which deductions do the most damage to margin.
The pocket price waterfall
The pocket price waterfall groups deductions into two categories: on-invoice deductions the shopper sees at checkout, and off-invoice costs the retailer absorbs afterward. Together, they show how much cash actually reaches the retailer.
On-invoice deductions
On-invoice deductions happen at checkout and appear on the customer's receipt, such as promotional discounts, markdowns, coupons, and loyalty rewards. Subtracting them from the list price gives the net checkout price.
Off-invoice costs
Off-invoice costs occur after the sale and dilute the remaining margin. The most common ones are delivery subsidies, payment and marketplace fees, and returns. Because they don't appear on the receipt, they're easy to miss in standard pricing KPIs that stop at the selling price. They matter most on high-volume products such as key value items (KVIs), where a small cost per unit adds up quickly.
Price waterfall example
The table below shows an illustrative price waterfall for one product sold online with a $100 list price.
Waterfall step |
Amount |
Running price |
List price | $100.00 | $100.00 |
Markdown | −$8.00 | $92.00 |
Promotional discount | −$5.00 | $87.00 |
Loyalty and coupon redemptions | −$3.00 | $84.00 |
Net checkout price | $84.00 | |
Delivery subsidy | −$4.00 | $80.00 |
Returns allowance | −$3.00 | $77.00 |
Payment and channel fees | −$2.50 | $74.50 |
Supplier rebates and vendor funding | +$2.00 | $76.50 |
Pocket price | $76.50 |
Table 1. Illustrative price waterfall example for a product with a $100 list price.
In this example, the retailer keeps $76.50 of every $100 of list price, so 23.5% of the list price leaks away before it reaches the bank. The markdown and the promotional discount are the largest single steps, which makes them the first candidates for review. Supplier funding appears as an upward step, because it offsets part of the deductions.
Price waterfall vs pocket margin waterfall
A price waterfall breaks the list price down into each deduction and ends at the pocket price, the revenue a retailer keeps per unit. A pocket margin waterfall goes one step further: it subtracts product cost and the cost to serve, such as fulfillment and handling, from the pocket price to show the pocket margin, the profit each sale actually earns. Retailers use the first to find revenue leakage and the second to judge profitability by product, customer, or channel.
The components of a retail price waterfall
A retail pricing waterfall tracks every factor that moves a product from its list price to its pocket price. Knowing each component is essential to see where revenue and margin are lost.
List price
The list price is the starting point of price waterfall analysis. Every discount, cost, and concession is measured against it to show how much value is lost before the pocket price.
Markdowns
Markdowns clear stock before a new season or at the end of a product's lifecycle. Markdowns timed by habit instead of demand data tend to go deeper and earlier than needed, which widens the gap between list price and pocket price.
Loyalty and coupon redemptions
Member perks and promo codes help win the basket and drive repeat visits, at the cost of lower realized margins. Retailers need to know whether the extra order volume actually compensates for the price reduction.
Price matching
Matching rival prices protects market share. Overly broad or automated price-match rules, though, drain margin on SKUs that never needed a discount in the first place.
Delivery subsidies
Free or subsidized delivery adds a cost to the transaction without increasing the selling price. Including these costs in the waterfall gives retailers a more accurate view of the economics of each order.
Promotional discounts
Promotions can speed up sales, but without demand data they often discount products that would have sold at full price. Reviewing common pricing mistakes helps pricing teams spot this pattern before it becomes a habit.
Returns
Returns hit margin twice: first through the lost order value, then through return shipping, processing costs, and markdowns on returned items that can't be resold at full price.
Supplier rebates and vendor funding
Supplier rebates are payments a retailer receives from a supplier when agreed conditions are met, such as sales volume targets or specific promotional activities. Vendor funding is broader and covers promotional budgets, advertising, and other marketing activities that suppliers finance.
Unlike the other components, rebates and vendor funding add back to the pocket price, so they appear as upward steps in the waterfall. Tracking them per SKU shows whether a promotion was genuinely funded by the supplier or paid for out of the retailer's own margin.
Other concessions
Service credits, goodwill gestures, payment processing fees, and special account terms for business customers quietly trim the top line. Keeping them small and visible is part of how to increase profit margin.
How to conduct a price waterfall analysis
Price waterfall analysis audits every deduction between the shelf price and the bottom line to pinpoint where margin leaks. Here is a step-by-step approach.
Step 1: Collect all price deduction data across the full chain
Collect every deduction: store markdowns, promotions, loyalty and coupon redemptions, delivery costs, returns, fees, and vendor funding. Clean data is essential, because missing even a few backend fees distorts the whole analysis.
Step 2: Calculate the pocket price per SKU or category
Calculate the pocket price after all relevant deductions. Comparing results across products and categories, alongside a price index calculation, helps identify where pricing and margin performance differ most.
Step 3: Identify the largest sources of margin leakage
Rank deductions by total dollar amount and by share of list price. This quickly exposes the handful of line items doing the most damage to the bottom line.
Step 4: Diagnose the commercial cause of each major gap
A large deduction isn't automatically a mistake, so diagnose the cause before acting. Is a promotion growing basket size and attracting new customers, or is it mainly giving discounts to shoppers who would have paid full price?
Step 5: Model margin recovery scenarios before changing policies
Run proposed changes, such as shallower promotions or new free-delivery thresholds, through data-driven pricing scenarios first. Scenario modeling projects volume shifts, revenue impact, and net margin recovery before anything goes live.
Why price waterfall analysis matters for enterprise retailers
Fraction-of-a-percent gaps compound fast when a retailer sells millions of units. A price waterfall turns those blurry backend losses into specific, measurable recovery projects.
Making hidden margin leakage visible
A price waterfall gives an honest view of list-to-pocket price erosion. Merchandisers, buyers, and finance teams work from the same data on where profit goes missing.
Identifying inconsistency in discount and concession practices
Store teams, regional managers, and marketing leads often handle promotions differently across channels. Mapping the waterfall catches misaligned discounting before it becomes standard practice and keeps realized prices consistent with the retailer's value-based pricing strategy.
Connecting pricing decisions to commercial outcomes
Price cuts affect more than single transactions. They shape category profitability and can weaken brand perception. Linking each deduction to the volume it generated helps teams decide where dynamic pricing adds value and where to defend the starting price.
How Competera supports price waterfall management
Competera turns static waterfall reporting into active pricing decisions. Pricing leaders use Competitive Data, demand modeling, and portfolio analytics in the Competera Pricing Platform to catch margin leakage at the source instead of accepting it as a cost of doing business.
Portfolio-level margin analytics across the full assortment
The Competera Pricing Platform tracks pricing performance across channels, stores, and categories in BI dashboards, at any level of granularity. Pricing managers can spot promotion concentration, unusual price variance, and underperforming SKUs, then prioritize where recovery efforts matter most.
Competitive Data to prevent unnecessary price concessions
Competitive Data gives pricing teams verified competitor prices with context, such as promotion flags and stock availability, so a temporary rival promotion or an out-of-stock listing doesn't trigger an automatic price match. It delivers more than 119 million data points each month across 34 markets, with up to 99% match accuracy and a 98% delivery SLA.
Combined with demand modeling in the Pricing Platform, this lets teams hold base prices everywhere except on the SKUs where matching a competitor actually protects volume.
What-if simulation for waterfall recovery scenarios
Competera's What-if simulations let teams test pricing scenarios before prices go live. Teams can model later markdown timing, shallower promotions, or re-indexed base prices and compare the projected revenue, margin, and volume outcomes side by side.
Demand-informed pricing that reduces unnecessary discounting
Moving inventory rarely requires deep blanket discounts. Contextual AI, the demand-led package of the Pricing Platform, weighs more than 20 demand factors to predict whether a price cut will generate incremental volume, protecting margin on products that sell without help.
Proof points and client outcomes
Retailers using the Competera Pricing Platform report 3–7% revenue growth and a 2–5 percentage point margin improvement. The Flaconi success story shows how a luxury beauty retailer used price optimization to cut the time spent on pricing processes by 50%.
Conclusion
A price waterfall gives a step-by-step account of how list price erodes into real revenue. Mapping every markdown, promotion, delivery subsidy, return, and fee leaves margin leaks nowhere to hide.
The goal of price waterfall analysis is to keep the promotions that build customer value and cut the ones that only burn margin, then test better pricing rules across the entire network.
Talk to an expert to see how Competera helps you find and recover margin leakage across your assortment.
FAQ
A price waterfall is a visual breakdown of how a product's list price is reduced, step by step, through markdowns, promotions, fees, and other deductions until it reaches the pocket price the retailer keeps.
The pocket price waterfall tracks the full chain of price reductions, from checkout discounts to backend costs such as delivery, returns, and fees, that determines how much revenue a retailer actually keeps from each sale.
The purpose of a price waterfall chart is to show how the list price turns into a smaller pocket price and which deductions take the biggest share of revenue along the way.
The main components of a price waterfall are the list price, markdowns, promotional discounts, loyalty and coupon redemptions, price matching, delivery subsidies, returns, other concessions, and supplier rebates and vendor funding.
To conduct a price waterfall analysis, collect clean deduction data, calculate the pocket price per SKU or category, rank the largest sources of margin leakage, diagnose the commercial cause of each, and test changes in pricing scenarios before rolling them out.
List price is the starting price on the shelf or product page. Pocket price is the net revenue a retailer keeps after every discount, delivery cost, return, and fee is subtracted and any supplier funding is added back.
Retailers recover margin through price waterfall analysis by finding the deductions that drain the most profit, cutting promotions and concessions that don't generate incremental volume, and testing optimized pricing scenarios before changing prices.
References
- Marn, M. V., & Rosiello, R. L. (1992). Managing price, gaining profit. Harvard Business Review. https://store.hbr.org/product/managing-price-gaining-profit/92507